
Provincial Seasonal Rainfall Map
Provincial seasonal rainfall graphs provide useful information about a region's rainfall but do not give a clear indication of where the major rain events actually occurred. For that, we will look at a provincial seasonal rainfall map from SAWS. Note that areas with above-average rainfall are likely to have wet soil conditions (high soil moisture values). These conditions reduce the ability of the ground to absorb additional rainfall.
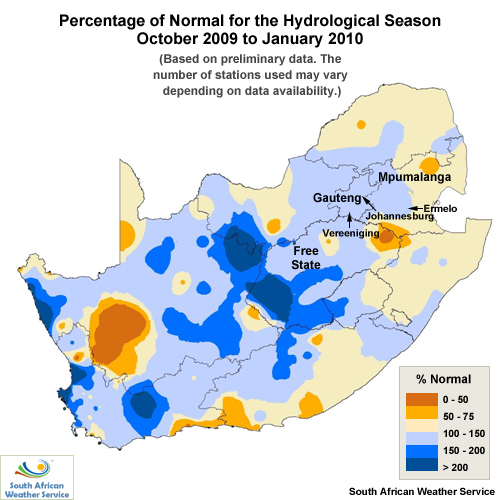
Forecasters should start being concerned about rainfall-induced flooding when rainfall reaches between 100 and 150%. According to these data, which areas are at risk of flooding? Select all that apply, then click Done.
The correct answers are B and C.
The regional map helps narrow our focus. All of Gauteng is at risk for flooding since it received between 100% and 150% of its average rainfall. Significant portions of Mpumalanga are at risk as well, with some areas receiving 100% to 150%. Some areas within Mpumalanga received below average rainfall, from 50% to 75%.