
Real-Time Vs. Predicted Percent Capacity of the Dam
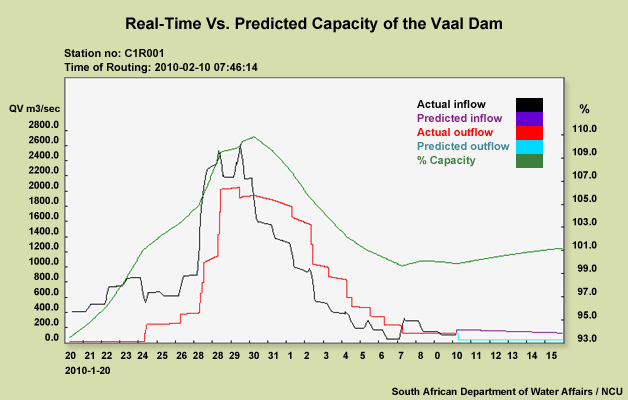
This hydrology graph shows actual and predicted inflow and outflow rates for the Vaal Dam and its percent capacity levels through 15 February. The actual figures go from 20 January to 10 February, while the predicted figures extend from 10 to 15 February.
Based on this information, when was it MOST critical to provide hydrological management structures with highly accurate forecasts of precipitation amounts, timing, and intensity?
The correct answer is A.
The correct answer is A. As the green line shows, the dam's percent capacity increased rapidly from from 94% on 21 January to 105% on 27 January. This means that as the volume of the dam increased, the dam was less capable of taking in more water. More rain was expected in the following days, which would increase already high ground moisture levels. Since the hydrological situation was expected to worsen considerably, hydrological management structures would need as much meteorological information as possible (possibly more than once per day) as quickly as possible. The situation from 27 to 31 January was also critical but the management structures would have been fully aware of the risks by this stage and taken the necessary safety measures. Note how conditions stabilized between 1 and 6 February, with the inflow of water into the dam decreasing steadily.