WV Imagery Overlaid with Model Wind Fields
Starting with 500 hPa, click each tab, review the image, and then answer the question below it. When you have finished all three questions, move on to the next page.
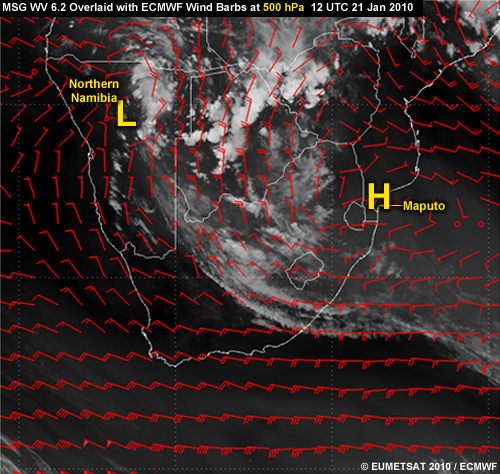
There's at least one 500-hPa high (anti-cyclonic) and low (cyclonic) on this image. Click each of these areas on the map. When finished, click Done.
There are two systems in the image: 1) a 500-hPa high over the Maputo area, and 2) a 500-hPa low over northern Namibia, which appears as more of a wave than a closed low. Scroll up to the top and click the 700-hPa tab.
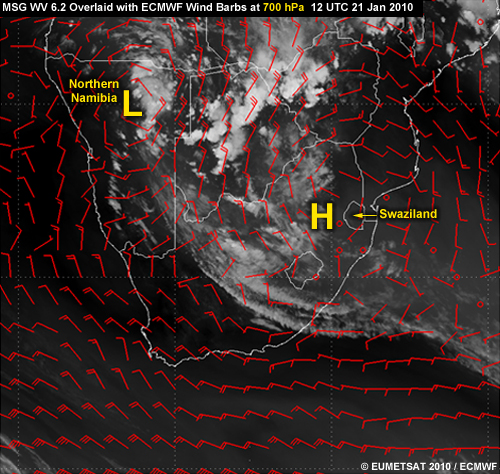
There's at least one 700-hPa low and high on this image. Click each of these areas on the map. When finished, click Done.
There are two systems in the image: 1) a 700-hPa high just west of Swaziland in the region of the anti-cyclonic flow, and 2) a 700-hPa low over northern Namibia in the region of cyclonic circulation. Now click the 850-hPa tab.
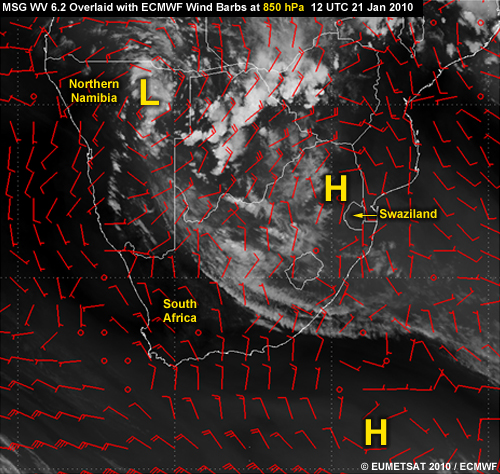
There's at least one 850-hPa low and high on this image. Click each of these areas on the map. When finished, click Done.
There are two systems in the image: 1) an 850-hPa high just west of Swaziland in the region of the anti-cyclonic flow, and 2) an 850-hPa low over northern Namibia in the region of cyclonic circulation. Click the next page button to proceed.