
Station Rainfall Maps
Review the provincial seasonal rainfall graphs
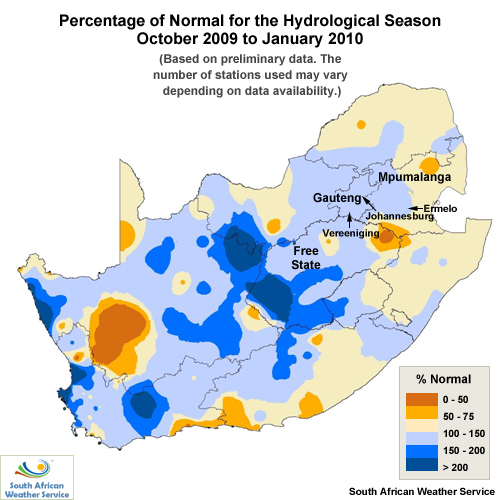
Review the provincial seasonal rainfall map
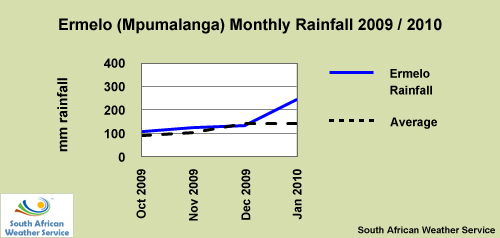
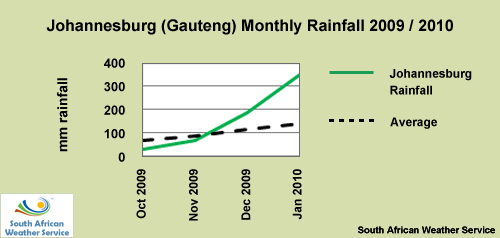
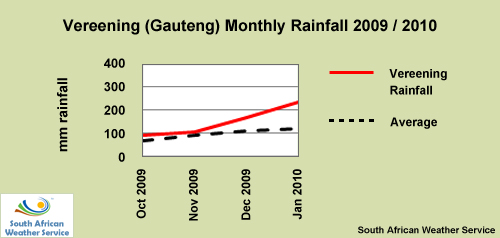
To gauge the likely impact of significant rainfall on hydrological conditions, it's important to know when the major rain events occurred. Were they spread out or clustered? Did they occur at the beginning or end of the season? To find this out, we'll look at actual rainfall graphs for the weather stations in Ermelo (Mpumalanga Province) and Johannesburg and Vereeniging (Gauteng Province).
Which statement is correct? (Choose the best answer.)
The correct answer is D.
As expected, rainfall rates increased at all three stations in January. But Johannesburg had the largest spike at the end of the period and is therefore at greatest risk of flooding should significant rain events occur. Note that the weather station rainfall records corroborate the data from the provincial seasonal rainfall map but not the provincial seasonal rainfall graph. For example, the graph showed a decrease in rainfall over Mpumalanga Province, while the Ermelo station rainfall map reported above average rainfall for the period. This highlights the importance of monitoring different types of data at different scales. You are far more likely to get an accurate picture of meteorological and hydrological conditions throughout your area of responsibility.