
Combined 7-Day Rainfall Accumulation vs. Dam Percent Capacity
The South African Department of Water Affairs (DWA) provides various hydrological data about the country's dams, including:
- Graphs of the relationship between rainfall accumulation and dam percent capacity
- Graphs of the real-time and predicted capacities of dams
For more information on DWA, visit http://www.dwaf.gov.za/.
We'll look at both types of data, the first one now, the second in a later section.
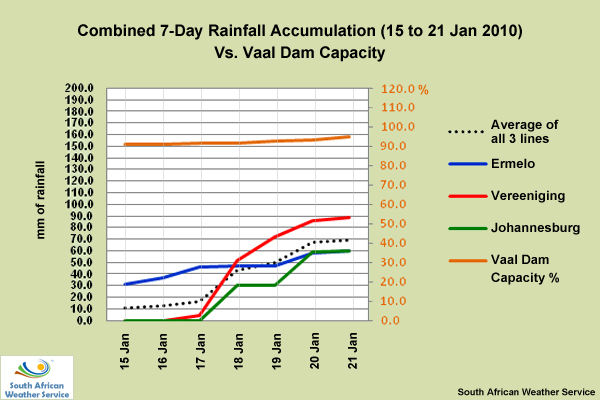
Here are the rainfall totals for the three stations compared to the percent capacity of the Vaal Dam from 15 to 21 January 2010. As you can see, the water level was at 90% capacity on 15 January and rose to 94% on 21 January. This was due, in part, to the continued increase in precipitation in the areas around all three weather stations. If precipitation continues, the levels will keep rising, making flooding an even more likely possibility. Keep in mind that there’s a time delay between an actual rain event and the water’s arrival at a dam. For the Vaal Dam catchment area, it takes approximately two days for rain at the furthest edge to arrive at the dam.
In the next section, we'll look at satellite, NWP, and radar data for 21 January 2010 and see if they indicate potential rainfall for the next days. Following that, we'll examine hydrological and rainfall data from late January and early February and see what actually happened to the Vaal Dam.